The Spyderbat Investigation UI
In the Spyderbat interface, notice the left-hand navigation menu.
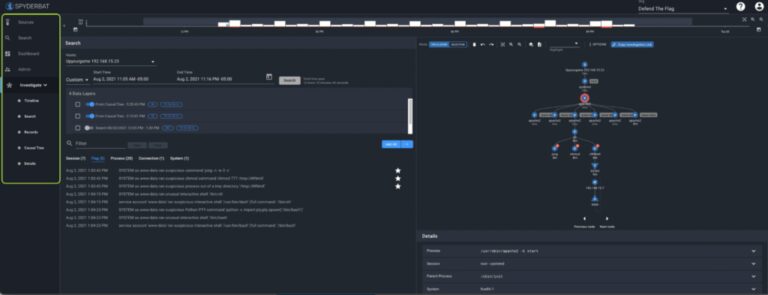
Click on “Investigate” to enter the investigation area of the product.
Under the investigate header are toggles turning on or off the various components of the investigate screen.
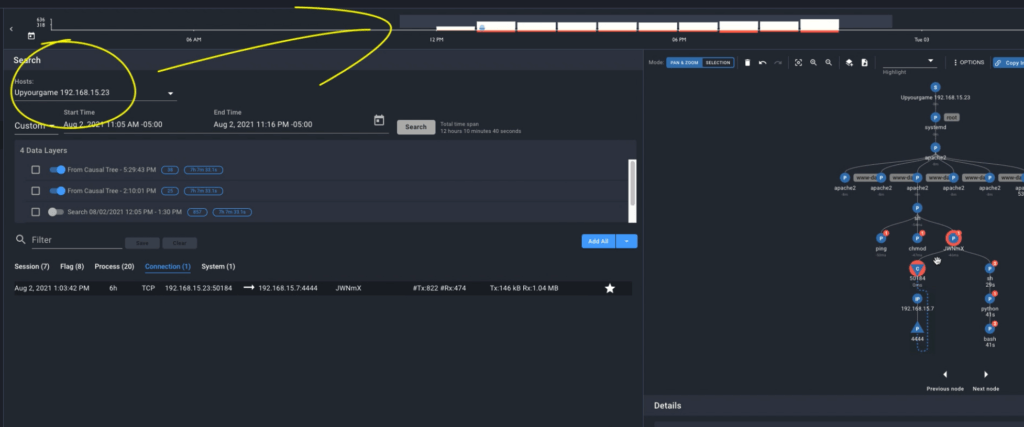
Search
The search area allows you to query for records, or all of the information Spyderbat has gathered, for one or more systems over the selected time frame.
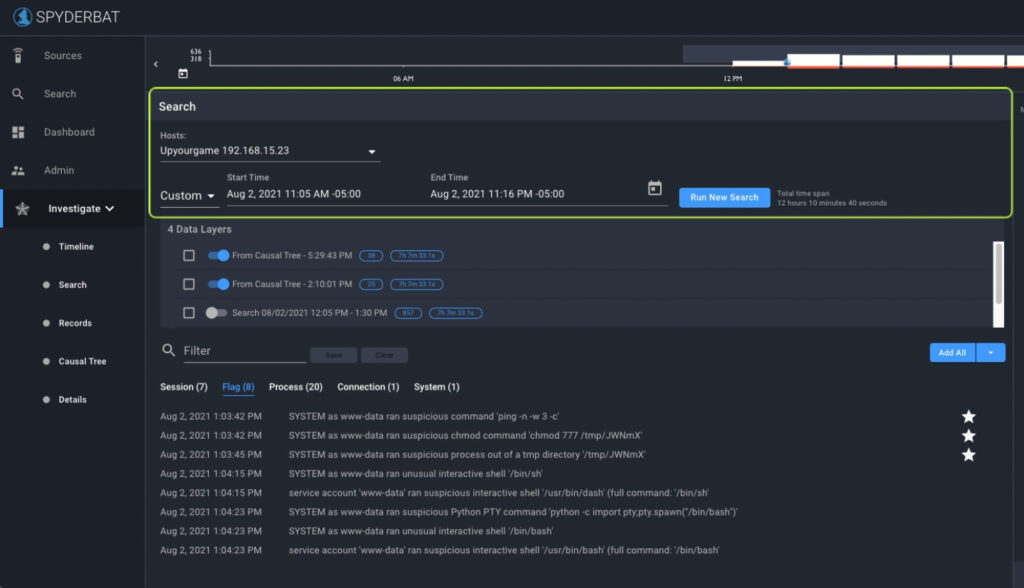
Here we see that we have a 1 hour query for a machine. Selecting the drop-down under ‘Hosts‘ allows you to query a different machine for the same time period.
You’ll notice that by running a new search results in a new data layer. A data layer is similar to the concept of layers in something like Adobe Photoshop, it allows you to bring in records or information for different times and for different systems, or from search or dashboards – and toggle those datasets on or off for analysis.
Records
The Records table below the data layers acts on the datalayers that you have enabled. While you can broadly filter data by enabling/disabling data layers, filtering Records allows for finer-grain views into the data set.
For example, type in an IP address where it says ‘Filter’ and click “Save” to filter down to all records related to that IP.
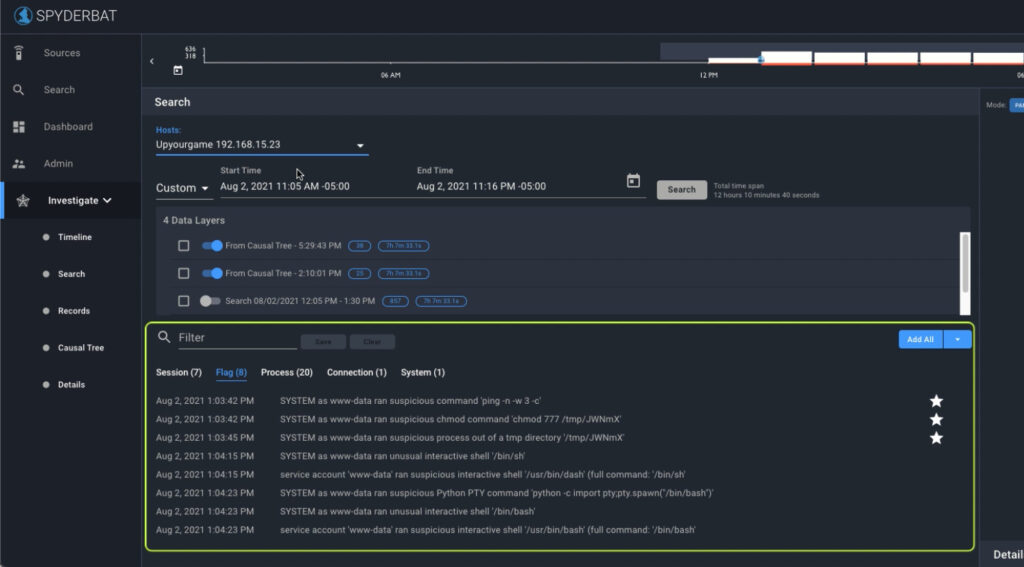
You can also use field-based filtering and “facets” to look for that IP.
For example, click on ‘Filter’ and scroll down the field-based names to find ‘remote_ip’ to see a list of all remote IP addresses included in the enabled data layers (if any).
Once we have narrowed down to a set of records of interest, we can plot these on the causal graph by selecting the ‘Star‘ icon to the right of the record.
Select the ‘Flag’ facet. Flags are often a great place to start – they provide interesting security context information that can be overlaid onto the Causal Tree. Use the “add all” button to add all Flags at once to the Causal Tree.
Causal Tree
Looking at the causal tree on the right-hand side is a very powerful way to view the causal connections of the underlying data.
- S nodes represent systems
- P nodes represent processes
- C nodes represent connections, which can relate to other connection nodes or to or from remote IPs and ports.
The Causal Tree displays all the causal activity leading to and following an event, such as an alert I am investigating.
The grey badges to the right of a node on the Causal Tree show changes in the effective user, or the effective rights of the user when performing tasks. This provides an immediate visual indication of the effective user’s privileges when executing commands.
Click here for a deep dive on the Causal Tree.
Using your mouse scroll bar or icons on the screen, zoom in and out of the Causal Tree.
Select a node by left-clicking with your mouse to see additional details in the Details panel, or right-click to add or remove information from the Causal Tree.
Tip – You can clear the graph with the trashcan icon, and the undo and redo buttons are very handy!
Details
The Details panel below the graph allows us to drill into details for nodes we’ve selected from the Causal Tree or Records table. Details include useful, context-based information about the selected node and its relationships to other nodes.
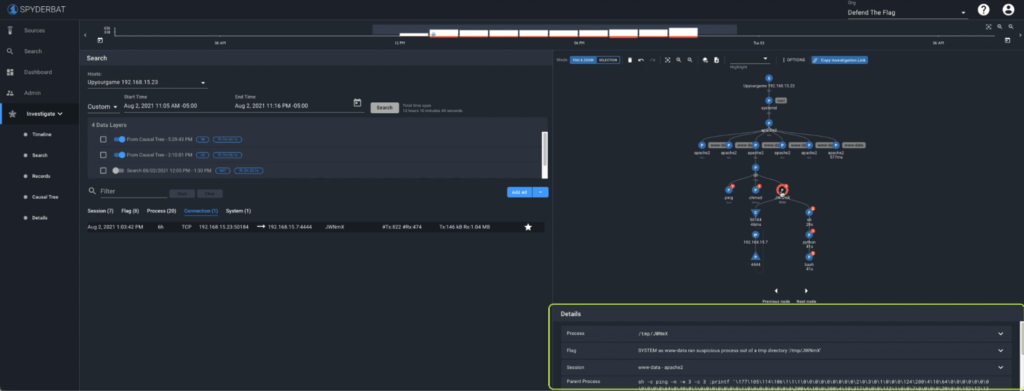
Here we can see the time this process ran, the command line, environment variables and much more, and any related information like flags or associated connections.
Timeline
Finally, the Timeline panel at the top provides a visual indication of system activity and flags over time for the system or host selected in the drop-down.
The blue dot represents the time a particular selected process ran and the width indicates the duration.
That’s a whistle-stop tour of Spyderbat investigations, we’ll go deeper into the investigation components in other videos and show how you can start or add to an existing investigation using dashboard and search capabilities.
Thank you and Happy tracing!
Write a comment