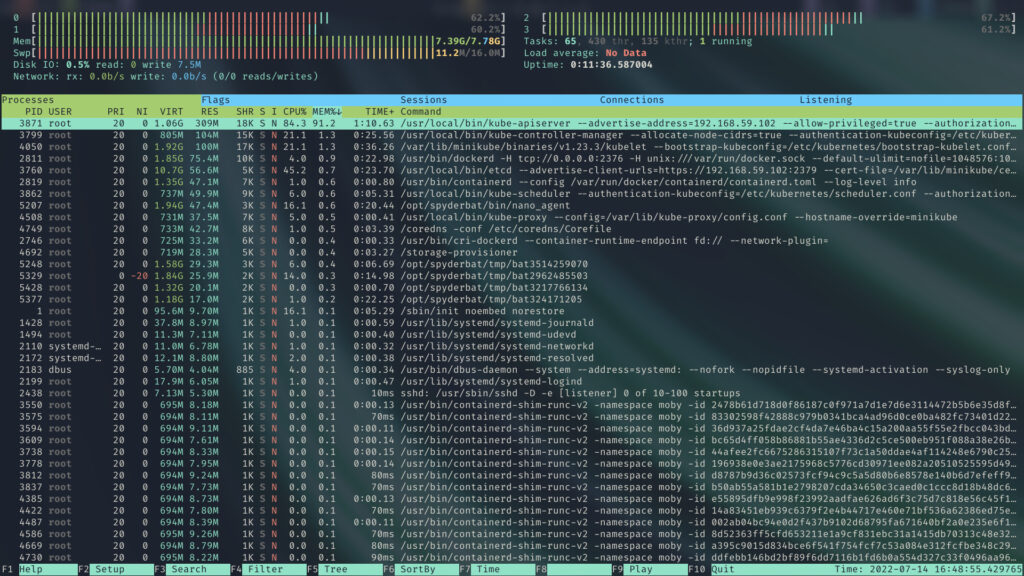
HTOP’s Strengths and Shortcomings
There is a program called “top” on most Linux systems for simple system monitoring. The tool lists the CPU and memory usage for the computer and each process, just as Task Manager does on Windows. HTOP is a more advanced and user-friendly version of top, displaying graphs in addition to raw values and adding colors for readability. Both programs are widely used for monitoring Linux systems, allowing administrators to track processes’ resource usage or quickly get a list of running tasks.
These tools are only designed to show the state of the system at the current moment. They lack the ability to record and display information even over the last few seconds as Task Manager does. This limitation is understandable since neither program is designed to log system performance or give a historical understanding of the machine. But what if the behavior you want to profile is intermittent, and you cannot be on the machine to run top when it happens?
Enter Spydertop
Spydertop is an open-source tool developed by Spyderbat that provides a solution for this currently unfulfilled use case. Utilizing Spyderbat’s kernel-level system monitoring and public APIs, it provides the same in-depth information as HTOP, and extends these abilities historically. Spydertop allows analysts to look into system anomalies days or even months after they occur.

How it works
Imagine a Kubernetes node that has the Spydertop Nano Agent installed. The agent collects the data necessary for Spydertop to function; for more details, refer to the FAQ or watch this video
on how to get it installed. On this system, there happens to be an application with a bug that causes it to continuously use up more memory. At 2:00 in the morning, the container reaches its memory limit and automatic safeguards restart the application. It begins to function correctly afterward, showing no signs of excessive memory usage.
In the morning, an analyst sees the crash report and decides to investigate. They start Spydertop on their own machine, and it uses Spyderbat’s public API to collect all the resource usage records from that early morning crash, as well as the active processes, connections, and more. Using these records, Spydertop displays the memory usage of the machine: 95% at 1:30 AM. By stepping through time, the analyst sees the memory slowly increase until the crash. Next, they sort the running processes by memory usage, find the buggy application, and can now resolve the issue.

How to use Spydertop
You can try out Spydertop by checking out the public repository or running the docker image. If you don’t have an API key yet, it will guide you through setting one up. After that, it is as simple as picking a machine and what time to investigate (both of which can be passed as command-line options for convenience).
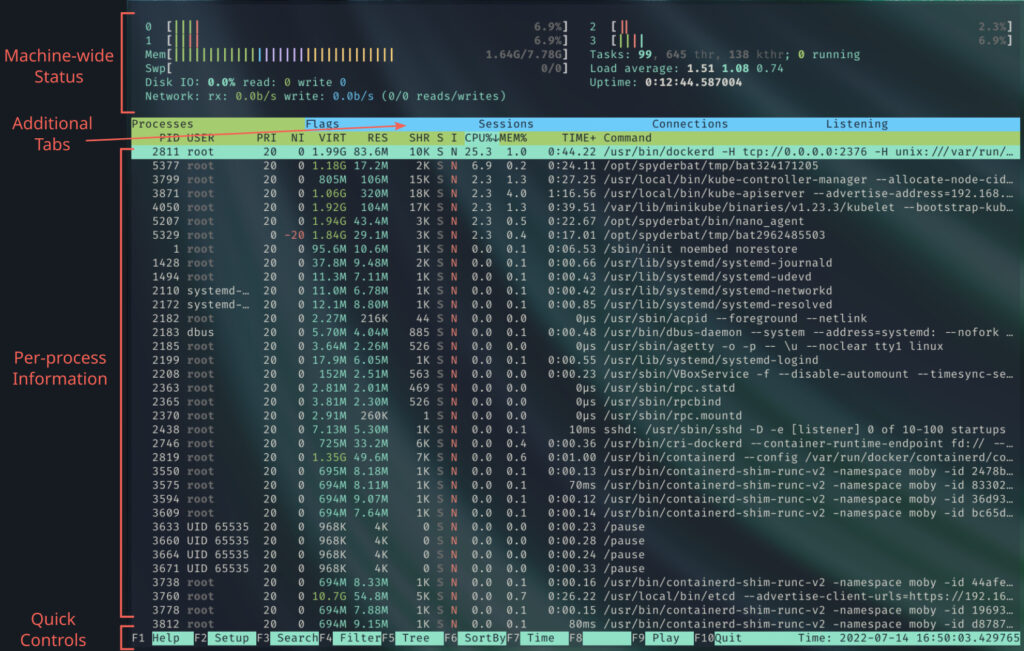
Once the necessary data has been loaded from the API, Spydertop presents a simple CLI interface. Spydertop aims to make the transition easy for users already accustomed to HTOP, so the user interface, buttons, and keyboard shortcuts are designed to be similar.
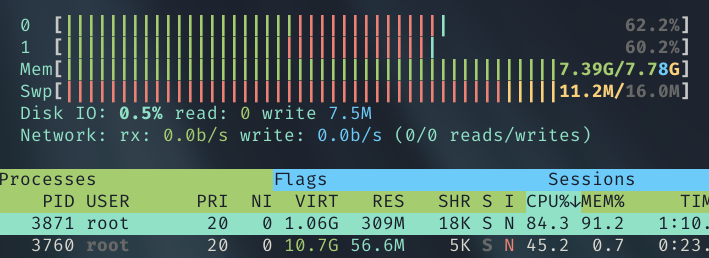
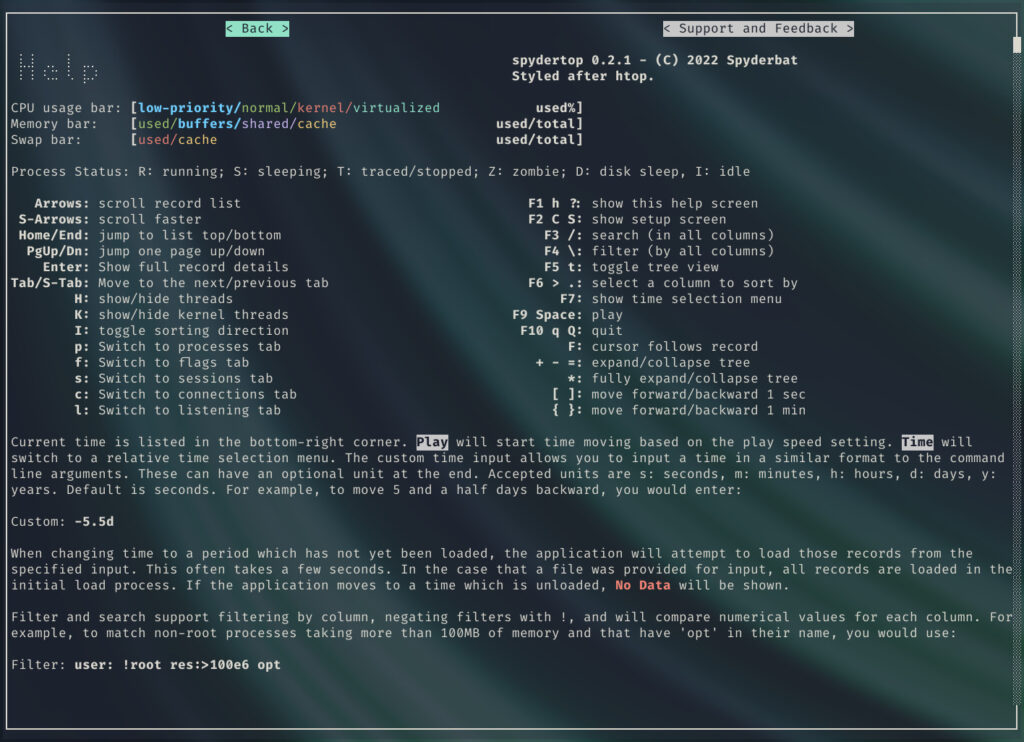
The first few lines display machine-wide resource usage information, such as CPU core usage and disk reads and writes. Taking up the rest of the screen is the process table, which shows resource usage and details for individual processes. Several other tabs are available in this table to show the active sessions, connections, flags, or listening sockets. At the bottom of the screen is a list of quick shortcuts, including a help menu where you can find more detailed information and a list of key binds. A description of command-line options is also available by passing the –help flag.

Get started using Spydertop for free by installing the python CLI, or try it without an account by running the docker image with a set of example data:
docker -it run spyderbat/spydertop -i examples/minikube-sock-shop.json.gzHere is the built-in help:

Write a comment