Spyderbat offers security teams a qualitatively different approach to investigating intrusions and security events. Designed with the perspective of the working analyst in mind, Spyderbat presents analysts with all system activities – spanning user sessions, systems, and extended timelines – in a comprehensive, contextualized interface based on their causal relationships. This Universal Causal Graph enables investigators to get to the root causes of events in a mere fraction of the time they would spend trying to manually build out a clear causal sequence from various logs.
To better understand how Spyderbat works and how radically it changes the investigative work of security analysts, we can look at a real scenario and compare log-based investigative practices with ATI at critical junctures along the way.
A Case Study in AuditD
The selected scenario for this study involves reconstructing the commands, privileges, and pathways that lead to the deletion of a Kubernetes cluster from a config server in a larger project. The misconfiguration event unfolds in a few discrete steps:
- A canary test fails to match the Kubernetes API with a particular cluster.
- A notification is issued in the team’s connected Slack channel.
- A DevOps engineer sets about trying to explain what happened.
AuditD
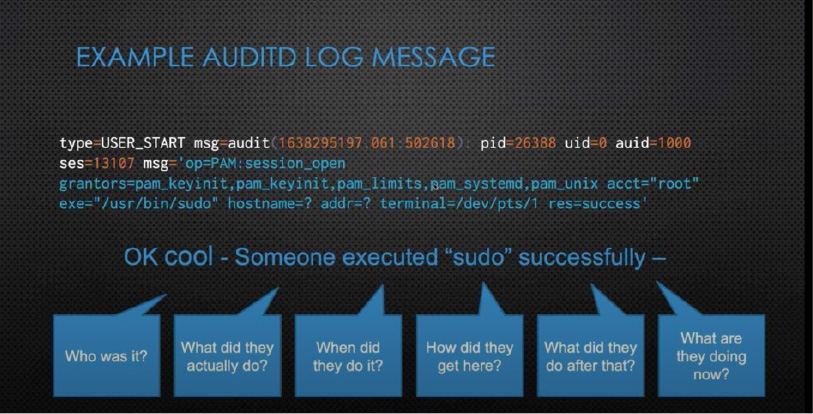
The Linux kernel contains a native auditing system – AuditD – that generates log entries to record system information according to default or configurable rules. In this case study scenario, AuditD by default logs messages for executed commands.

While the log message does include the command, the time it was executed, a user ID, and an authenticated ID, it includes no actionable information about who exactly the user is and what happened before and after the execution of the command.
Alternatively, when AuditD is configured to log a range of exec vi calls, the poverty of information becomes an unmanageable surplus of log messages. As it is not container-aware, AuditD cannot, by default or configuration, identify a meaningful range of activities to log in association with the problem being investigated.
In either case, the engineer tasked with getting to the cause of the problem will have to cobble together an explanation by collating large amounts of unstructured information from various logs for all systems in the environment.
Spyderbat
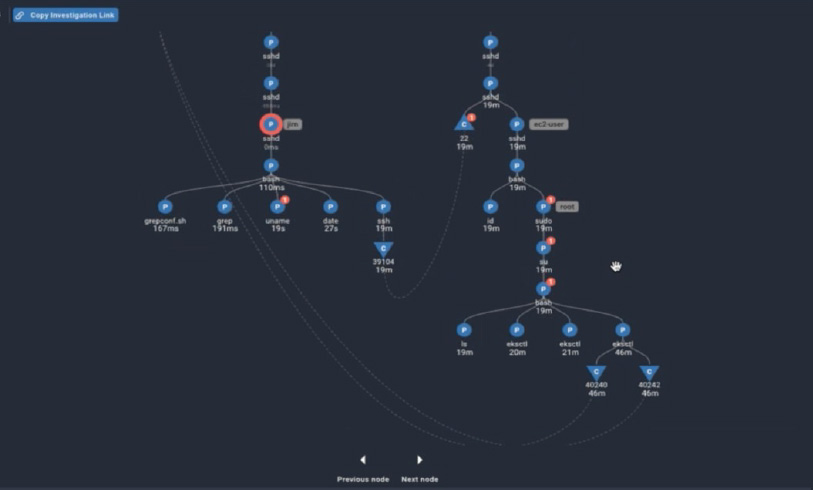
With Spyderbat, this scenario unfolds rather differently. Prior to the event in question, Spyderbat uses a lightweight nanoagent to record all system calls, processes, and network connections across the entirety of your environment. Spyderbat continually stitches these activities together based on their causal relationships into Spyderbat’s Universal Causal Graph.
At the point of the canary failure in the scenario, the engineer can search in the Spyderbat console for instances of commands associated with cluster management. A command to delete a cluster appears in the returned instances, allowing a trace to be opened for that specific event.

In Spyderbat, individual traces are slices of the Universal Causal Graph that indicate all activity causally connected to a selected node. Upon opening the trace, the DevOps engineer immediately identifies the server, user privileges, and processes that preceded the cluster deletion. Since the command was executed by a shared account, in approximately four minutes, the investigator identifies the actual user and the complete chain of commands and processes by which the user reached the traced node where the cluster was deleted simply by broadening the scope.
In short, the DevOps engineer working in the Spyderbat console effectively compresses a few days to weeks of log diving into a handful of clicks and searches, reconstructing exactly what happened with a higher degree of certainty.
Experience ATI for Yourself
Learn more about ATI and schedule a demo from Spyderbat today.
Write a comment