
Software developers have long deployed fundamentally different kinds of debugging tools to find and fix application errors. Standard debugging approaches fall into two broad categories – logging and tracing.
· Logging: Provides static analysis at given moments in the execution of a program, reports preselected errors and failures, and helps explain discrete events.
· (Distributed) Tracing: Provides dynamic analysis over the duration of a process, records event narratives, and reveals cross-cutting concerns in which multiple application aspects are interdependent.
While developers know that neither logging nor tracing is inherently superior as a debugging method – each has preferable use-cases – both methods strive to create visibility into processes. One with highly detailed snapshots, the other with narratives and contextual sequence.
However, on the security side of the DevOps world, logging – enhanced with alerts and notifications – has almost exclusively defined problem-solving approaches to network threats and attacks. In this regard, operations teams have tended to lack process visibility comparable to that which developers can obtain when things go awry.
System-Level Tracing for SecOps
The absence of the kind of context-illuminating visibility that tracing provides – in contrast to the static, isolated snapshots of log messages – is particularly glaring in today’s characteristically multicloud-based Linux environments. As the spaces and perimeters that security teams defend become increasingly virtualized and decentralized, the existing toolkit for network defense experiences reduced effectiveness.
The Linux-native auditing tool – auditd – generates customizable log entries for visibility to system level activities. Logging is very sparse by default, With configuration, it’s easy to ‘turn on the firehose’ of audited activities that still somehow omits key details. For example, auditd is inherently container and virtual machine unaware, rendering it critically incapacitated right off the bat in complex, cloud architectures. As it is, even under the best possible configurations, it has no visibility into the kinds of events and processes that SecOps need to see.
To make sense of events spanning highly variable timescales – from seconds to months – across multiple microservice architectures, and systems of varying degrees of integration and abstraction, requires system-level process visibility. Spyderbat addresses this systemic blind spot by design. Leveraging eBPF, Spyderbat proactively records all system calls, network connections, processes, and user sessions throughout the entirety of your environment. At this point tracing and system visibility connect in Spyderbat’s Universal Causal Graph (UCG) which weaves together the system activities it records – including third-party alerts – into a visual trace with nodes representing events and connections between nodes representing causality. When suspicious or anomalous activity trips an alert, the analyst has immediate access to an exhaustive and visually represented trace for the event in question.
Perched at this superior vantage point, security teams and cloud engineers have the comprehensive visibility to apply their experience and skills rapidly and dynamically. Not only can they cut response times from days to hours – or even minutes – they can often connect the dots in Spydertraces fast enough to intervene against malicious activity in real-time.
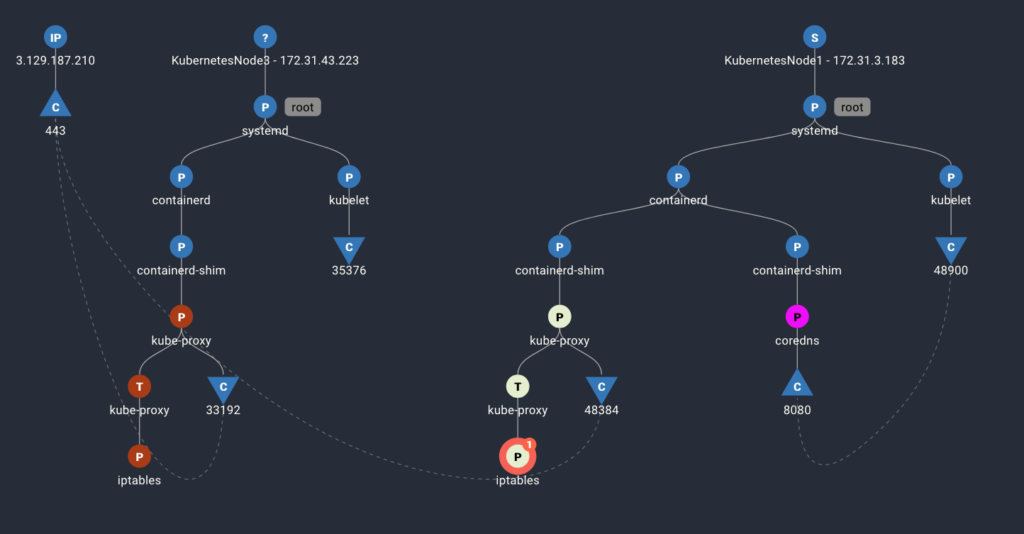
- Spyderbat’s tracing captures system and network activity by their causal relationships.
- Both container and host activities are represented. In the image, the blue nodes represent activities on the host, the other colors represent different container activities.
- Inbound and outbound network connections, to external systems or internal systems/containers, are seen with the processes that received/sent them.
Create your own traces with Spyderbat Community Edition
Spyderbat enables users to see tracing in action on their own Linux systems. Deploy up to 5 agents with Spyderbat’s always-free Community Edition.
To explore the Spyderbat experience, visit Spyderbat today.
Write a comment