OK, you installed your first Spyderbat Nano Agent (How-to Install the Spyderbat Nano Agent). Now what?
1) Look at the last hour of activity
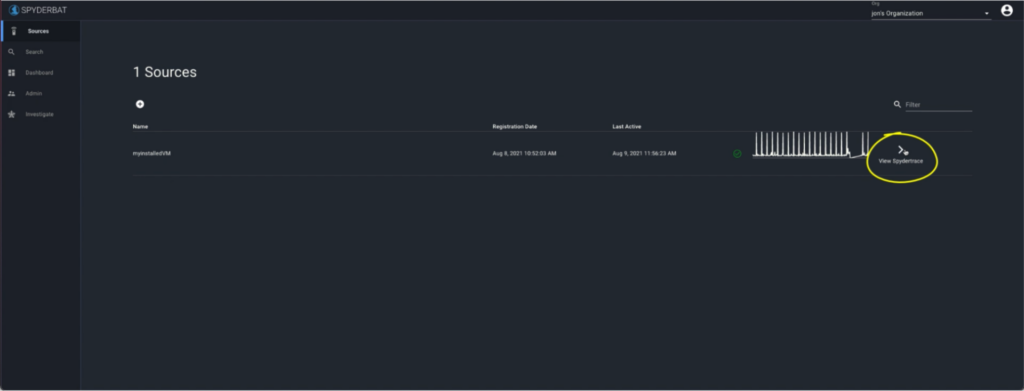
If you just installed the Spyderbat Nano Agent, you will see the system as a source on the Sources screen.
On the left, click “View Spydertrace”. This will query the last hour of activity from that system.

2) View Your Own Activity
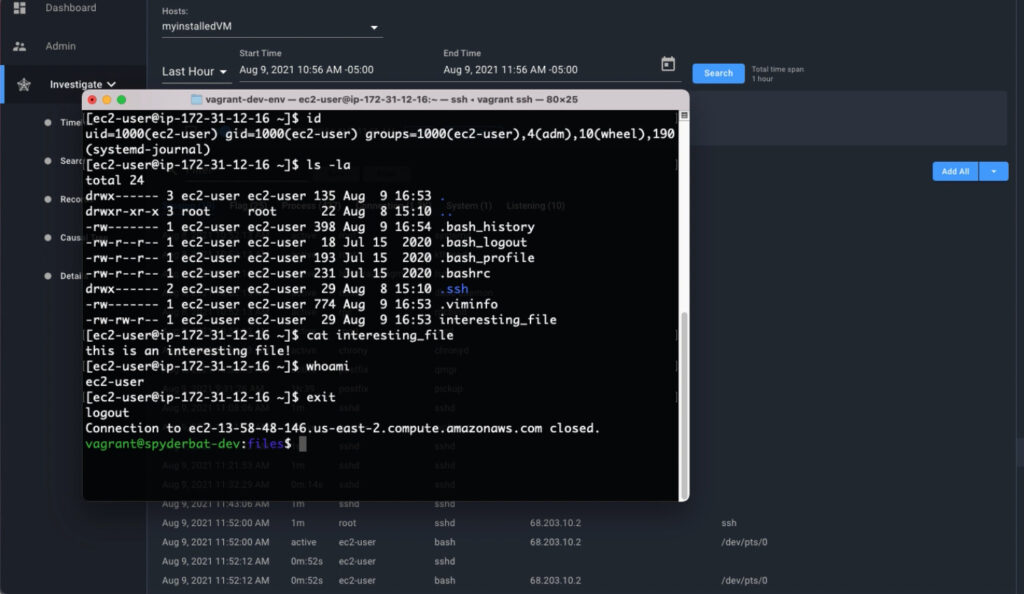
Do you still have a terminal open from when you installed the agent? If not, log back into the system you installed the agent on.
Run some simple Linux commands;
>clear
>id
>ls -la
> cat .profile
> whoami
> exit

Let’s jump back to the Spyderbat investigate screen.
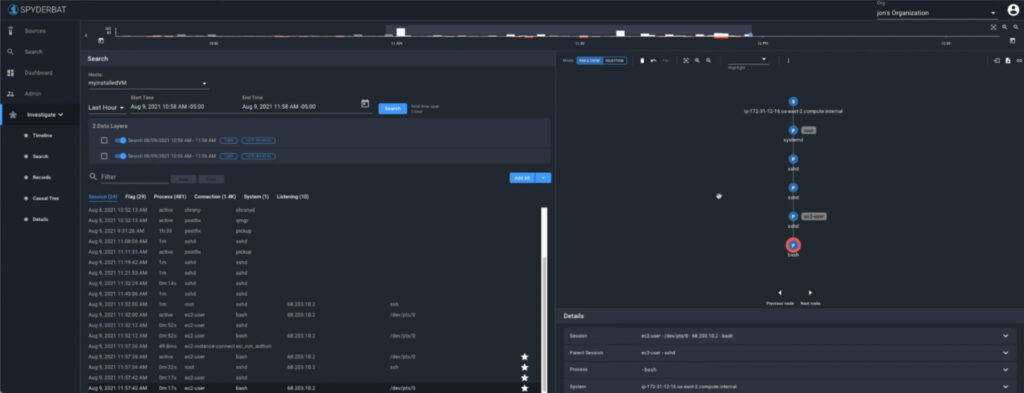
Under Search, click on the End Time, select the ‘Now‘ button to update the End Time to the current time, and then select the ‘Run New Search‘ button.
That query brought in records for the requested time period as a new Data Layer.
Look in the Records table, under the Sessions tab. Can you find your recent session? Click on the ‘Star‘ to the right of the Session Record to see what it looks like in the Causal Tree.

The session in the above screen shot shows my session using a bash shell. Notice I was logged in as ec2-user. By right-clicking on the bash shell process node in the graph, select “add children” .
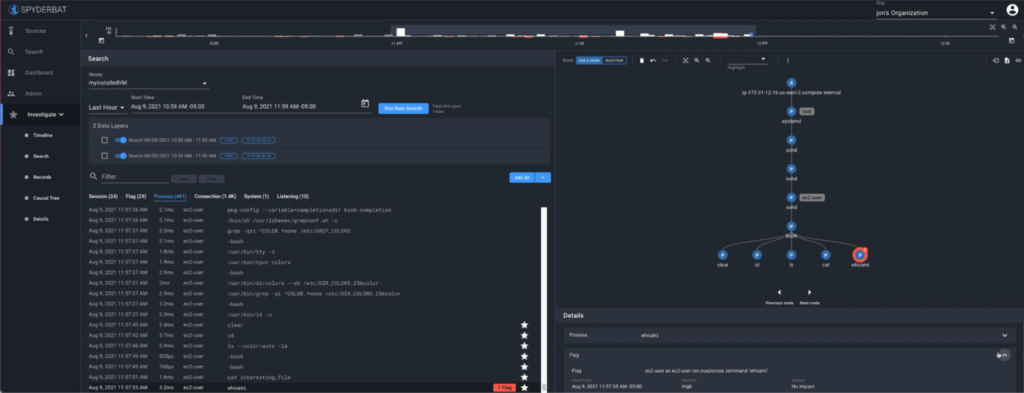
The Causal Tree updates to displays all commands (and processes) that are immediately causally connected to the bash shell. I also see the processes selected in the records table when I view the Records table Process tab.
By selecting the ‘cat’ node in the Causal Tree or process name in the Records table, the Details panel provides additional details such as the filename, the working directory, environment variables, and more!
3) View Your First Flag
Do you recall running the ‘whoami’ command? In our Causal Tree, it is annotated with a little flag.
Select the ‘whoami’ node in your Causal Tree to view more information from the Details panel.
Flags are not the same as alerts. Flags color your Causal Tree with interesting information. The source of a Flag can be third-party alerts as well as other context sources. Spyderbat continuously overlays key security and other context as Flags as they occur.
A single Flag with no causal outcomes is a characteristic of a false positive. A trace of interest will usually include multiple Flags and multiple layers of activity. By viewing alerts and context as Flags, the Causal Tree shows you exactly how they are related, the sequence of activities, and any other activity causally connected.

Other Things to Try
Here are some other great things to try with your Spyderbat Community Edition:
- If you haven’t already, check out the Defend The Flag challenges. Challenges are quick exercises that allow you to explore and learn about real attacks in a very fun way
- Have a colleague do some basic admin tasks on a system that has the Spyderbat Nano Agent installed, see if you can figure out what they did in Spyderbat and compare notes with them.
- Install Spyderbat on a Vulnhub VM from vulnhub.com (see Spyderbat Blog – How to Setup Community Edition to Monitor Systems from Vulnhub) and hack it, and see what Spyderbat shows. Many of the vulnhub images have walk throughts if you are not an experienced pentester.
- Stand up a honeypot or similar system on the internet that can be easily exploited to see what Spyderbat captures!
- Want to bring in the rest of the team? Try a red team/blue team exercise where the red team attacks a set of Linux systems, and the blue team defends using Spyderbat!
Thank you and happy tracing!
Write a comment